
go-libp2p is the core networking component for many go-based implementations like Kubo (IPFS), Lotus (Filecoin), and Prysm (Ethereum Beacon Chain).
We've added instrumentation to collect metrics from various components, which have already helped debug nuanced issues and develop features.
Check out the public dashboards to see metrics from different libp2p components in production.
Why Prometheus?
We chose Prometheus over OpenCensus and OpenTelemetry because:
- OpenCensus creates a lot of allocations, leading to increased GC pressure
- OpenTelemetry's metrics API is still unstable
- Prometheus is performant (zero-alloc) and ubiquitous
We also added ready-to-use Grafana dashboards.
How to Enable Metrics
Metrics are enabled by default since go-libp2p v0.26.0. Just setup a Prometheus exporter:
func main() {
    http.Handle("/metrics", promhttp.Handler())
    go func() {
        http.ListenAndServe(":2112", nil)
    }()

    host, err := libp2p.New()
    // ...
}
Point your Prometheus instance to scrape from :2112/metrics.
Discovering Available Metrics
go-libp2p provides metrics and Grafana dashboards for all major subsystems. Check the dashboards directory for available Grafana dashboards.
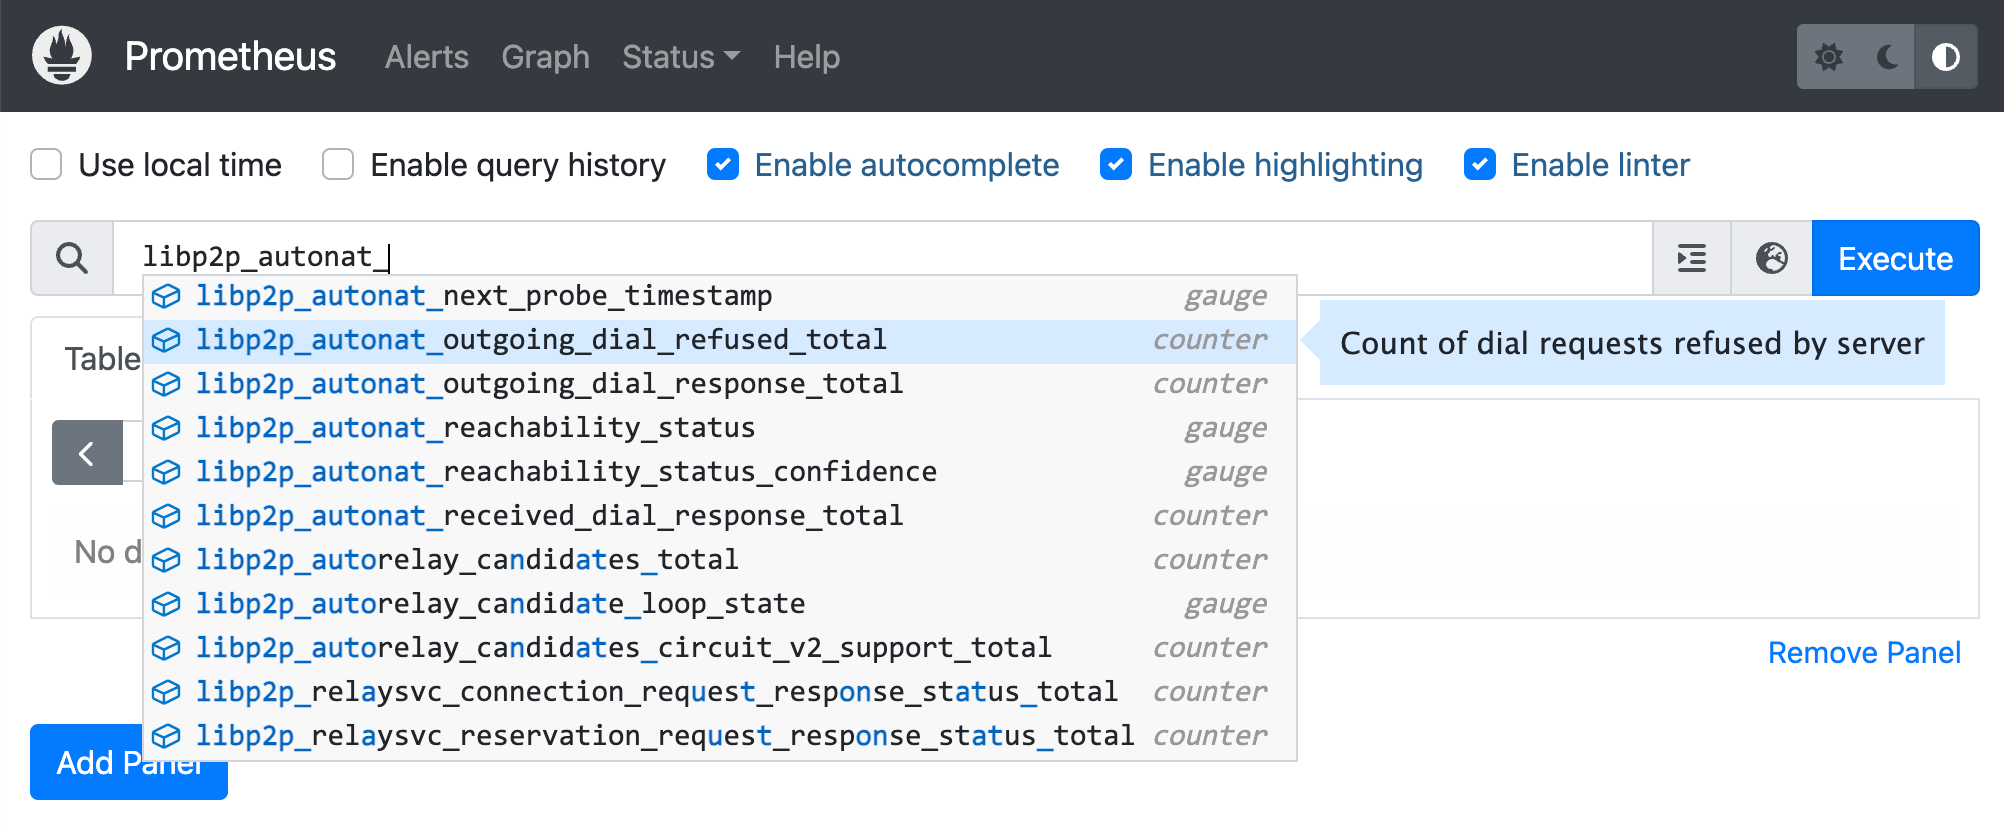
To discover metrics, type libp2p_(libp2p-package-name)_ in the Prometheus UI and find available metrics from autocomplete.
Impact
These metrics have already helped us:
- Debug AutoNAT issues
- Optimize the Resource Manager
- Improve connection handling
We encourage users to deploy these dashboards and share feedback!